---
title: "Endpoints in PV"
subtitle: "Personal Reference — Clinical Trial Endpoints, Biomarkers & Outcome Measures"
author: "Ashwin"
date: last-modified
format:
html:
theme: JOURNAL
toc: true
toc-depth: 3
number-sections: true
code-fold: true
code-tools: true
fig-width: 8
fig-height: 5
df-print: kable
execute:
warning: false
message: false
---
```{r setup}
library(tidyverse)
library(gt)
library(scales)

# -- Color palette --
pal <- list(
  rusf     = "#8B1A1A",
  placebo  = "#9ca3af",
  blue     = "#1B3A5C",
  blue_mid = "#2E6B9E",
  gold     = "#C4960C",
  green    = "#2D7D46"
)

theme_pv <- theme_minimal(base_size = 13, base_family = "sans") +
  theme(
    plot.title = element_text(face = "bold", size = 14, color = "#1a1a2e"),
    plot.subtitle = element_text(size = 11, color = "#4a4a6a"),
    panel.grid.minor = element_blank(),
    panel.grid.major.x = element_blank(),
    legend.position = "bottom",
    axis.title = element_text(size = 11),
    strip.text = element_text(face = "bold")
  )
```
# VERIFY Study Design Overview
Phase 3, randomized, double-blind, placebo-controlled trial evaluating **rusfertide** (a hepcidin mimetic) plus current standard of care (CSC) in patients with polycythemia vera requiring frequent phlebotomy.
| Part | Design | Weeks | Purpose |
|------|--------|-------|---------|
| Part 1a | Double-blind, R 1:1 | 0–32 | Dose titration & primary efficacy |
| Part 1b | Open-label | 32–52 | Durability of response |
| Part 2 | Open-label | 52–156 | Long-term safety assessment |
| Part 3 | Open-label | 156–EOT | Treatment extension |
: VERIFY trial structure {.striped}
## Patient Disposition
```{r tbl-disposition}
tibble(
  Stage = c("Screened", "Screen Failures", "Part 1a (ITT)", "Part 1a (SAS)",
            "Part 1b (Open-label)", "Part 2 (Enrolled)", "Part 2 (Ongoing)"),
  `Rusfertide + CSC` = c("—", "—", "147", "145", "—", "—", "—"),
  `Placebo + CSC`    = c("—", "—", "146", "146", "—", "—", "—"),
  Total              = c(399, 106, 293, 291, 274, 267, 254),
  `Retention`        = c("—", "—", "—", "—", "93.5%", "—", "86.7%")
) |>
  gt() |>
  tab_header(title = "Patient Disposition Through VERIFY Trial") |>
  tab_style(
    style = cell_fill(color = "#f0f9f2"),
    locations = cells_body(rows = c(5, 7), columns = Total)
  ) |>
  tab_style(
    style = cell_text(weight = "bold", color = "#8B1A1A"),
    locations = cells_body(rows = 2, columns = Total)
  ) |>
  tab_footnote("ITT = intention to treat; SAS = safety analysis set; CSC = current standard of care") |>
  opt_row_striping() |>
  tab_options(table.font.size = px(13))
```
::: {.callout-tip}
## High Retention
93.5% continued to Part 1b, 86.7% remain ongoing at data cutoff. Only 2 randomized patients were not dosed.
:::
# Hematocrit Control {.primary-endpoint}
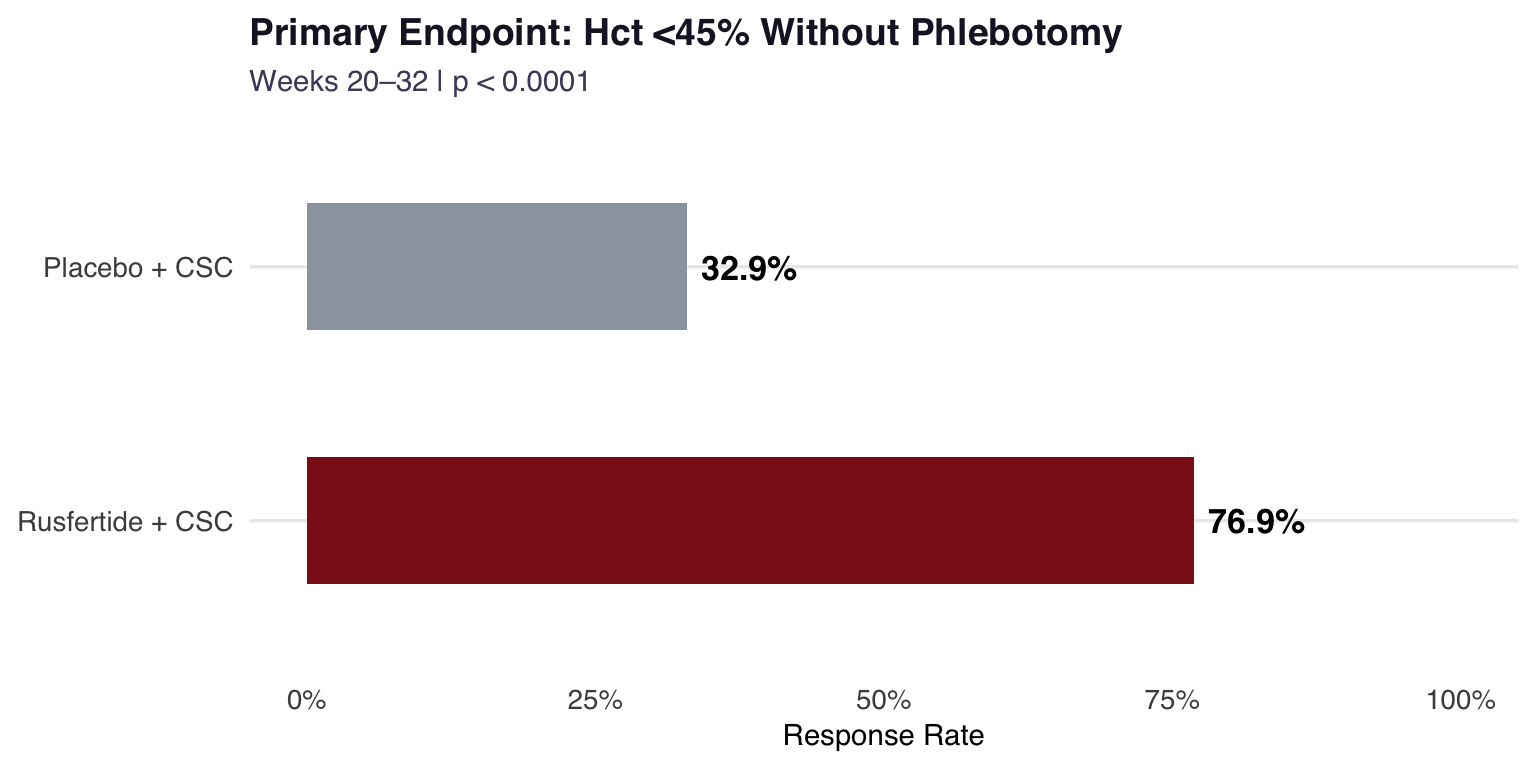
The primary endpoint was the proportion of patients with **Hct <45%** in the absence of phlebotomy from Week 20 to Week 32, grounded in the CYTO-PV trial.
```{r fig-primary}
#| fig-cap: "Primary endpoint response rate: Hct <45% without phlebotomy (Weeks 20–32)"
#| fig-height: 4
tibble(
  arm = c("Rusfertide + CSC", "Placebo + CSC"),
  rate = c(76.9, 32.9)
) |>
  ggplot(aes(x = fct_rev(arm), y = rate, fill = arm)) +
  geom_col(width = 0.5, show.legend = FALSE) +
  geom_text(aes(label = paste0(rate, "%")),
            hjust = -0.15, fontface = "bold", size = 4.5) +
  scale_fill_manual(values = c("Rusfertide + CSC" = pal$rusf, "Placebo + CSC" = pal$placebo)) +
  scale_y_continuous(limits = c(0, 100), labels = percent_format(scale = 1)) +
  coord_flip() +
  labs(
    title = "Primary Endpoint: Hct <45% Without Phlebotomy",
    subtitle = "Weeks 20–32 | p < 0.0001",
    x = NULL, y = "Response Rate"
  ) +
  theme_pv
```
```{r tbl-hct}
tibble(
  Endpoint = c("Hct <45%, no phlebotomy (Wk 20–32)",
               "Mean % time Hct <45% (Wk 20–32)"),
  Rusfertide = c("76.9%", "89.6%"),
  Placebo    = c("32.9%", "51.1%"),
  Difference = c("+44.0 pp", "+38.5 pp"),
  `P-value`  = c("<0.0001", "<0.0001")
) |>
  gt() |>
  tab_header(title = "Hematocrit Control Endpoints — Part 1a") |>
  tab_style(
    style = cell_text(weight = "bold", color = "#2D7D46"),
    locations = cells_body(columns = Rusfertide)
  ) |>
  tab_style(
    style = cell_text(weight = "bold", color = "#8B1A1A"),
    locations = cells_body(columns = `P-value`)
  ) |>
  tab_options(table.font.size = px(13))
```
# Phlebotomy-Free Endpoints
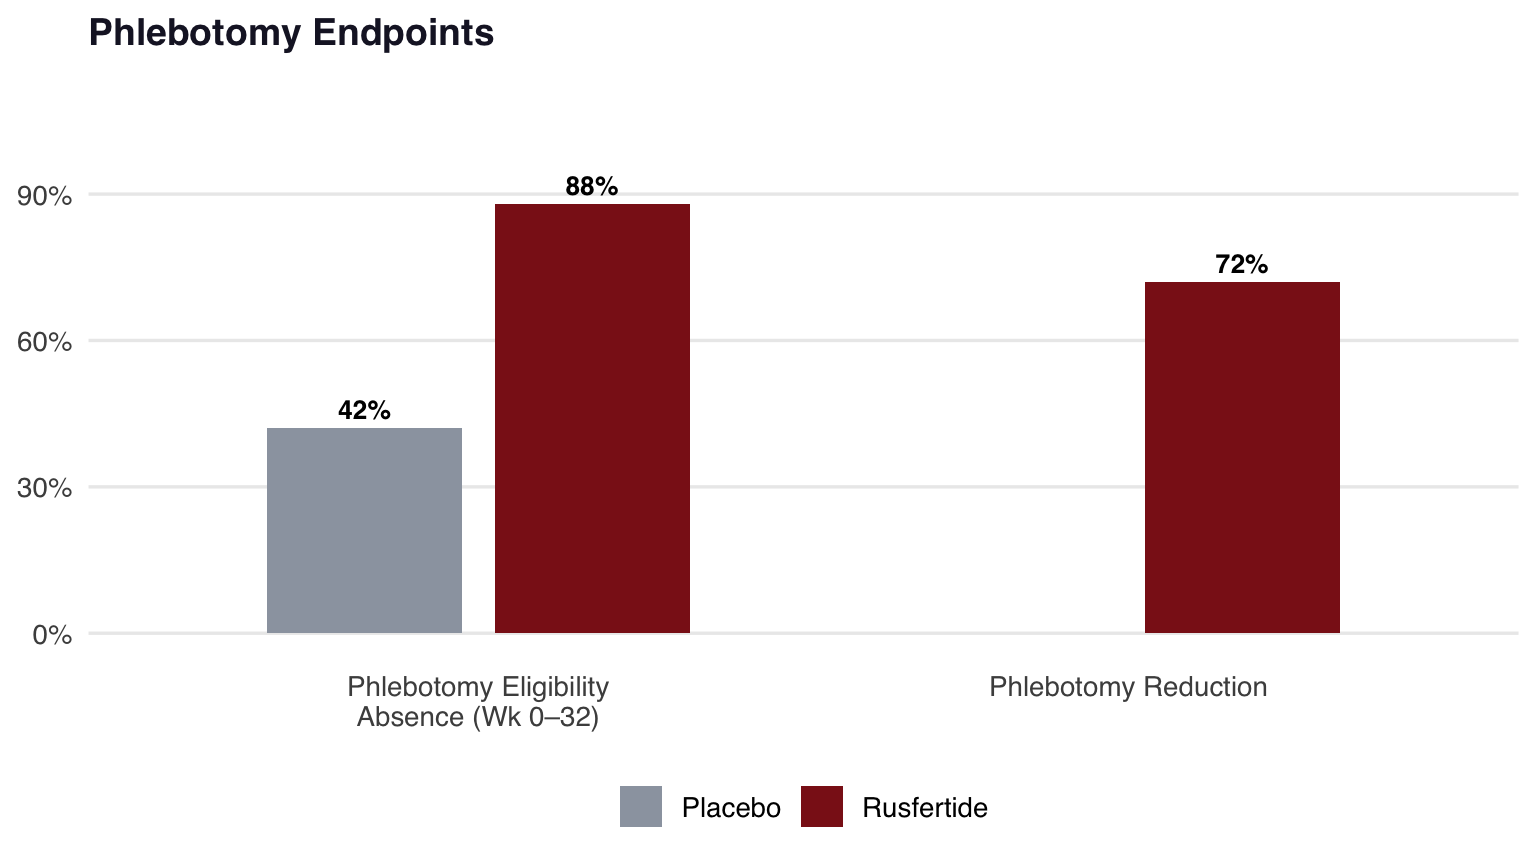
Phlebotomy burden is a core patient-centered outcome — 72% reduction in phlebotomy need with rusfertide.
```{r fig-phleb}
#| fig-cap: "Phlebotomy-related endpoints during Weeks 0–32"
#| fig-height: 4.5
tibble(
  endpoint = rep(c("Phlebotomy Eligibility\nAbsence (Wk 0–32)",
                    "Phlebotomy Reduction"), each = 2),
  arm = rep(c("Rusfertide", "Placebo"), 2),
  value = c(88, 42, 72, 0)
) |>
  ggplot(aes(x = endpoint, y = value, fill = arm)) +
  geom_col(position = position_dodge(width = 0.7), width = 0.6) +
  geom_text(aes(label = ifelse(value > 0, paste0(value, "%"), "")),
            position = position_dodge(width = 0.7), vjust = -0.5, size = 3.5, fontface = "bold") +
  scale_fill_manual(values = c(Rusfertide = pal$rusf, Placebo = pal$placebo)) +
  scale_y_continuous(limits = c(0, 110), labels = percent_format(scale = 1)) +
  labs(title = "Phlebotomy Endpoints", x = NULL, y = NULL, fill = NULL) +
  theme_pv
```
::: {.callout-note}
## Clinical Significance
Phlebotomy burden impairs quality of life: travel to infusion centers, post-procedure fatigue, iron depletion symptoms, and work disruption.
:::
# JAK2 VAF Reduction
Molecular response is of growing interest but faces significant unresolved questions.
## Assay Standardization
```{r tbl-jak2-assay}
tibble(
  Method      = c("qPCR (standard)", "ddPCR (digital droplet)", "NGS panels"),
  Sensitivity = c("~1–2%", "~0.01–0.1%", "~1–5%"),
  Precision   = c("Moderate", "High", "Variable"),
  Notes       = c("Most widely available; inter-lab variability",
                   "Gold standard for low-level detection",
                   "Captures co-mutations; higher cost")
) |>
  gt() |>
  tab_header(title = "JAK2 VAF Assay Comparison") |>
  tab_style(
    style = cell_text(weight = "bold"),
    locations = cells_body(columns = Method)
  ) |>
  opt_row_striping() |>
  tab_options(table.font.size = px(13))
```
::: {.callout-important}
## Unresolved
Molecular response is **not yet validated as a surrogate endpoint** in PV. IFN-alpha trials show correlation with reduced thrombosis, but causation is unproven. Rusfertide does not target the malignant clone directly.
:::
# Event-Free Survival
```{r tbl-efs}
tibble(
  Component = c("Major arterial thrombosis", "Major venous thrombosis",
                 "Major bleeding", "Transformation to MF",
                 "Transformation to AML", "Death (any cause)"),
  `Annual Rate` = c("1.0–1.5%", "0.5–1.0%", "0.5–1.0%",
                     "0.5–1.0%", "0.2–0.3%", "1.5–2.5%"),
  Measurement = c("MI, stroke", "DVT, PE, splanchnic", "ISTH criteria",
                   "WHO criteria + biopsy", "WHO criteria", "—"),
  Challenge = c("Low event rate", "Heterogeneous presentation",
                 "Competing risk with thrombosis", "Requires serial biopsies",
                 "Very rare; late event", "Competing causes in elderly")
) |>
  gt() |>
  tab_header(title = "Event-Free Survival Composite Components") |>
  opt_row_striping() |>
  tab_options(table.font.size = px(13))
```
```{r fig-efs}
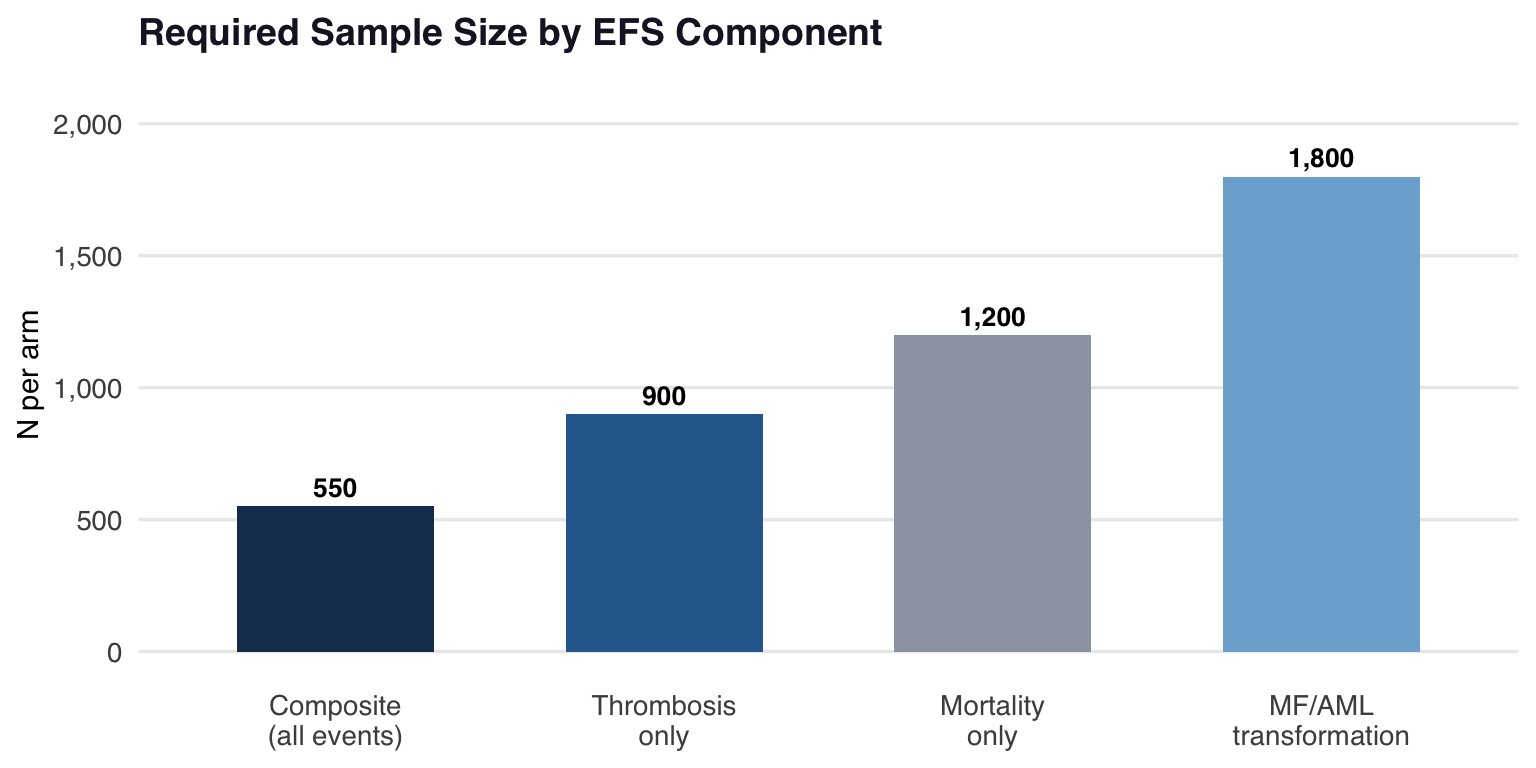
#| fig-cap: "Estimated sample sizes per arm for different EFS endpoints (HR=0.70, 5yr, 80% power)"
#| fig-height: 4
tibble(
  endpoint = c("Composite\n(all events)", "Thrombosis\nonly",
               "MF/AML\ntransformation", "Mortality\nonly"),
  n = c(550, 900, 1800, 1200)
) |>
  mutate(endpoint = fct_reorder(endpoint, n)) |>
  ggplot(aes(x = endpoint, y = n, fill = endpoint)) +
  geom_col(width = 0.6, show.legend = FALSE) +
  geom_text(aes(label = comma(n)), vjust = -0.5, fontface = "bold", size = 3.5) +
  scale_fill_manual(values = c(pal$blue, pal$blue_mid, pal$placebo, "#7BAFD4")) +
  scale_y_continuous(limits = c(0, 2100), labels = comma) +
  labs(title = "Required Sample Size by EFS Component", x = NULL, y = "N per arm") +
  theme_pv
```
::: {.callout-note}
VERIFY was not powered for EFS. A dedicated trial would need >1,000 patients with 5+ years follow-up.
:::
# Patient-Reported Outcomes
**VERIFY is the first Phase 3 trial in PV to prospectively demonstrate PRO improvement.**
```{r tbl-pro}
tibble(
  Instrument = c("MPN-SAF TSS", "PROMIS Fatigue", "EQ-5D-5L"),
  Domain     = c("Symptom burden", "Fatigue severity", "Health utility"),
  `Key Items` = c("Fatigue, pruritus, night sweats, concentration, early satiety, bone pain, abdominal discomfort, inactivity, weight loss, fever",
                   "Fatigue experience & impact on daily functioning",
                   "Mobility, self-care, activities, pain/discomfort, anxiety/depression"),
  Result     = c("Significant improvement", "Significant improvement", "Improvement observed")
) |>
  gt() |>
  tab_header(title = "PRO Instruments in VERIFY") |>
  tab_style(
    style = cell_text(weight = "bold", color = "#2D7D46"),
    locations = cells_body(columns = Result, rows = c(1, 2))
  ) |>
  tab_options(table.font.size = px(13))
```
```{r fig-pro}
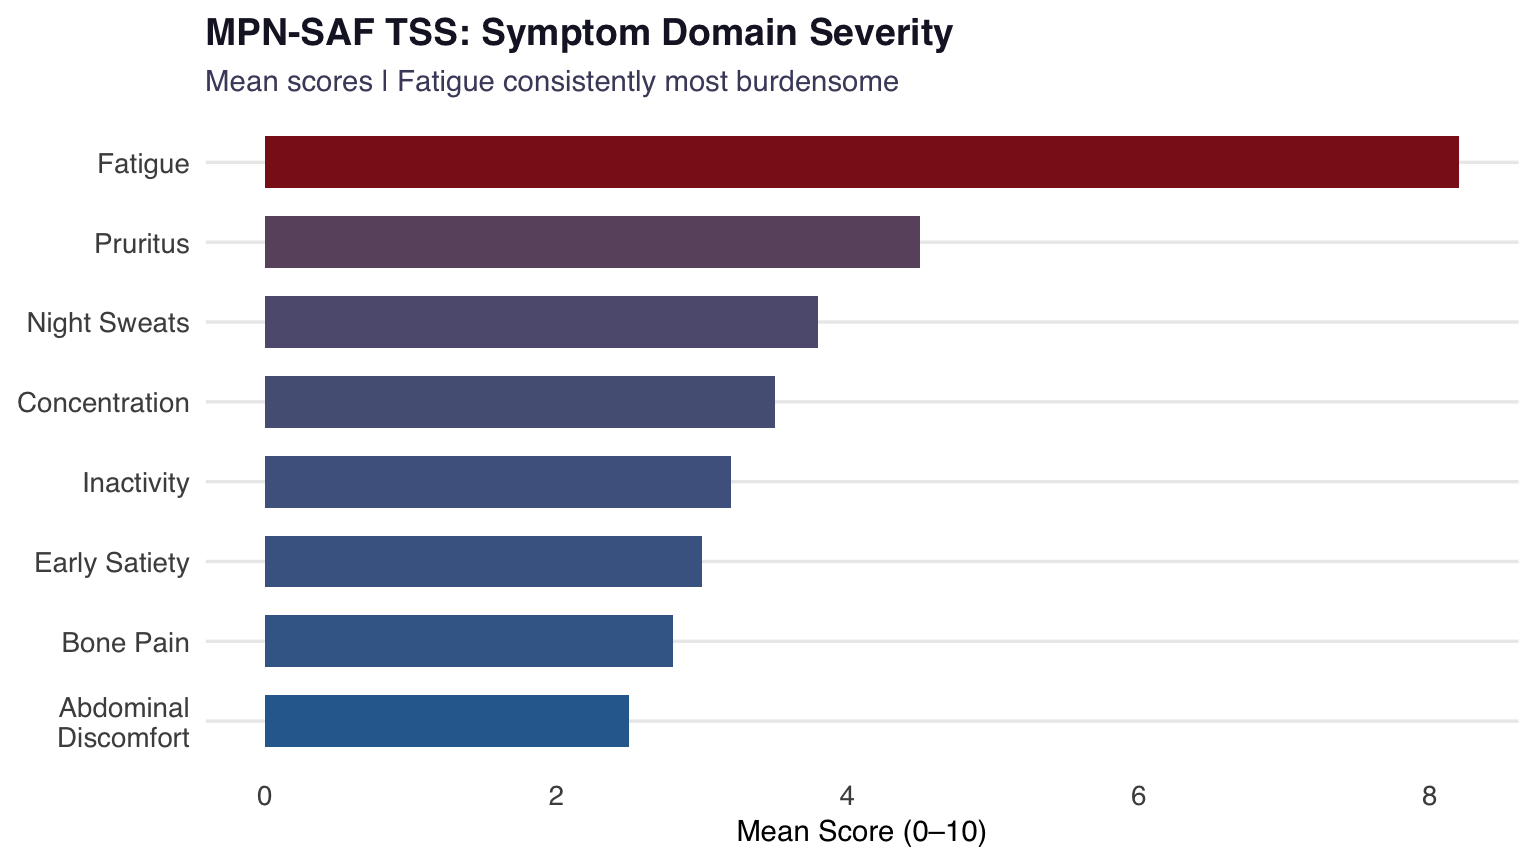
#| fig-cap: "MPN-SAF TSS: Symptom domain severity (mean scores) in PV"
#| fig-height: 4.5
tibble(
  symptom = c("Fatigue", "Pruritus", "Night Sweats", "Concentration",
              "Early Satiety", "Bone Pain", "Abdominal\nDiscomfort", "Inactivity"),
  score = c(8.2, 4.5, 3.8, 3.5, 3.0, 2.8, 2.5, 3.2)
) |>
  mutate(symptom = fct_reorder(symptom, score)) |>
  ggplot(aes(x = symptom, y = score, fill = score)) +
  geom_col(width = 0.65) +
  coord_flip() +
  scale_fill_gradient(low = pal$blue_mid, high = pal$rusf, guide = "none") +
  labs(title = "MPN-SAF TSS: Symptom Domain Severity",
       subtitle = "Mean scores | Fatigue consistently most burdensome",
       x = NULL, y = "Mean Score (0–10)") +
  theme_pv
```
# Iron Homeostasis & Ferritin
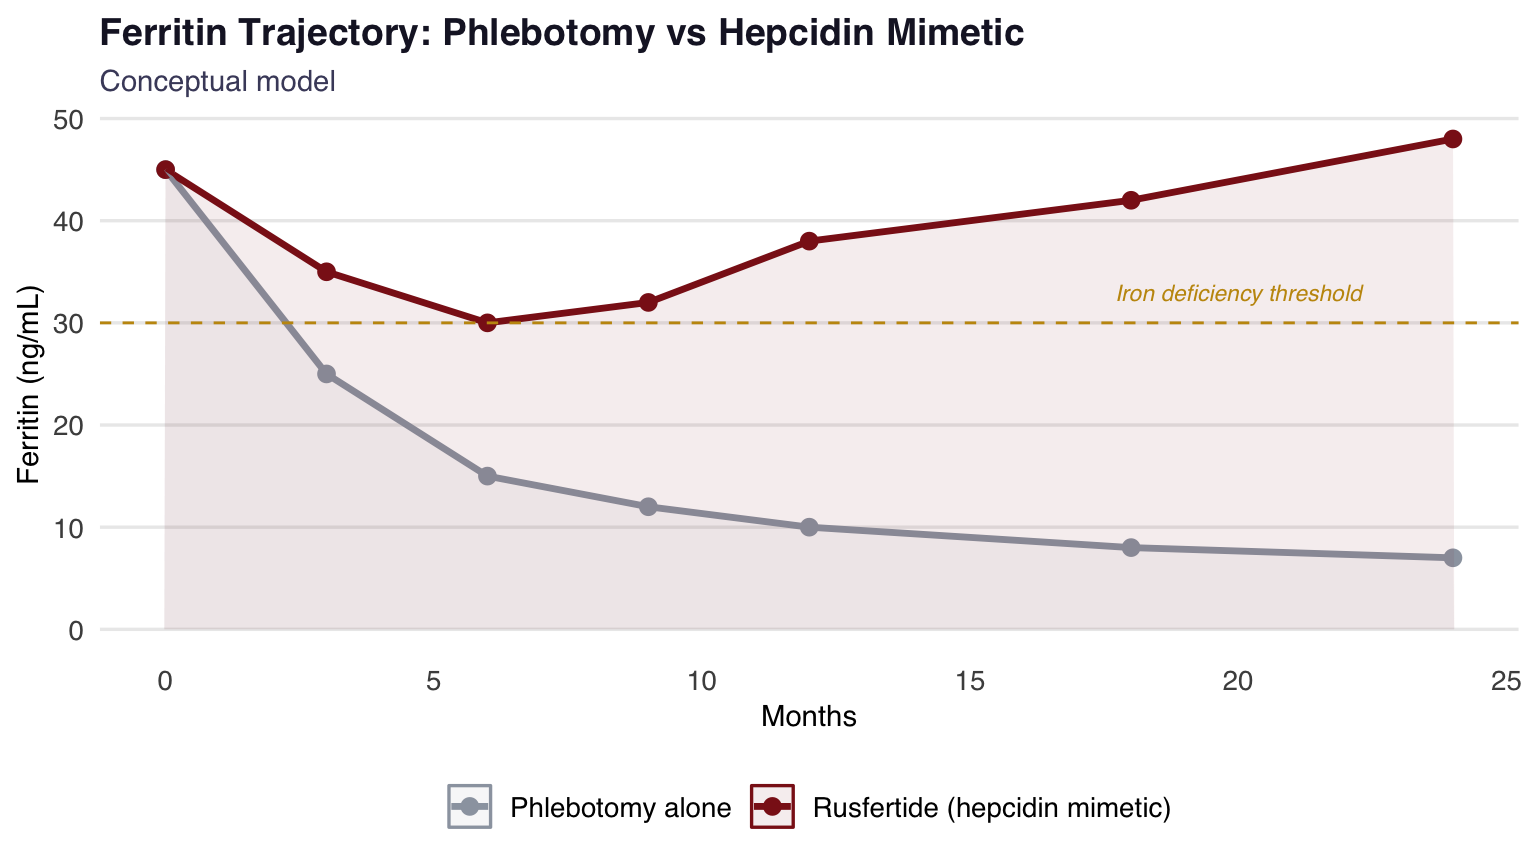
Phlebotomy-induced iron deficiency is pervasive and under-recognized. Rusfertide may spare systemic iron stores.
```{r fig-iron}
#| fig-cap: "Conceptual ferritin trajectory: phlebotomy vs hepcidin mimetic approach"
#| fig-height: 4.5
tibble(
  month = rep(c(0, 3, 6, 9, 12, 18, 24), 2),
  approach = rep(c("Phlebotomy alone", "Rusfertide (hepcidin mimetic)"), each = 7),
  ferritin = c(45, 25, 15, 12, 10, 8, 7,
               45, 35, 30, 32, 38, 42, 48)
) |>
  ggplot(aes(x = month, y = ferritin, color = approach, fill = approach)) +
  geom_line(linewidth = 1.2) +
  geom_point(size = 2.5) +
  geom_area(alpha = 0.08, position = "identity") +
  geom_hline(yintercept = 30, linetype = "dashed", color = pal$gold, linewidth = 0.5) +
  annotate("text", x = 20, y = 33, label = "Iron deficiency threshold",
           color = pal$gold, size = 3, fontface = "italic") +
  scale_color_manual(values = c("Phlebotomy alone" = pal$placebo,
                                "Rusfertide (hepcidin mimetic)" = pal$rusf)) +
  scale_fill_manual(values = c("Phlebotomy alone" = pal$placebo,
                               "Rusfertide (hepcidin mimetic)" = pal$rusf)) +
  labs(title = "Ferritin Trajectory: Phlebotomy vs Hepcidin Mimetic",
       subtitle = "Conceptual model",
       x = "Months", y = "Ferritin (ng/mL)", color = NULL, fill = NULL) +
  theme_pv
```
::: {.callout-important}
Iron deficiency drives symptoms **independent of hematocrit**: fatigue, cognitive impairment, restless legs, pica, and reduced exercise capacity — often incorrectly attributed to PV itself.
:::
# Disease Transformation
```{r fig-transform}
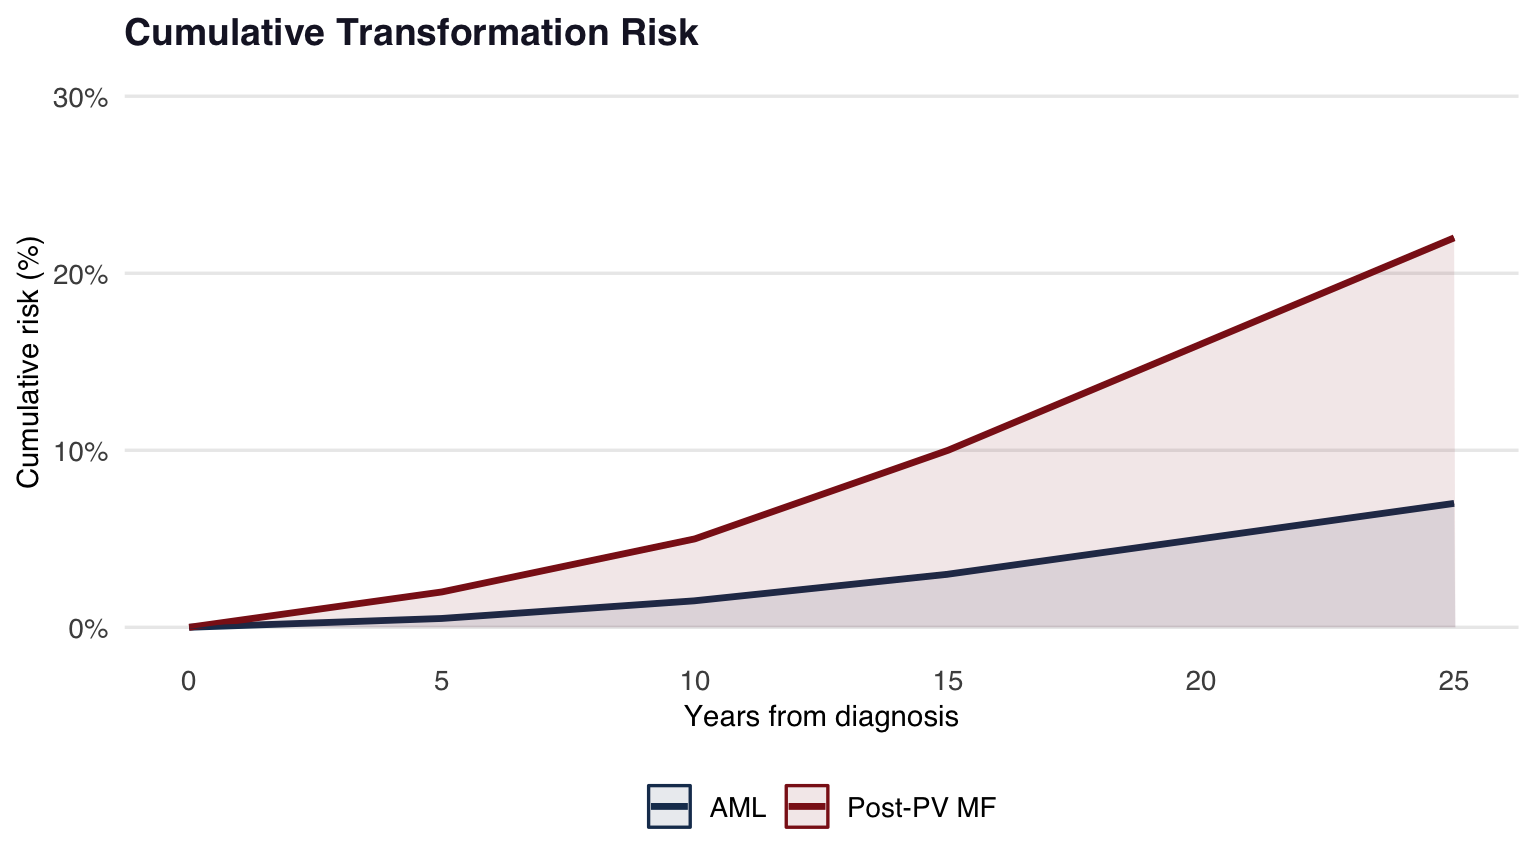
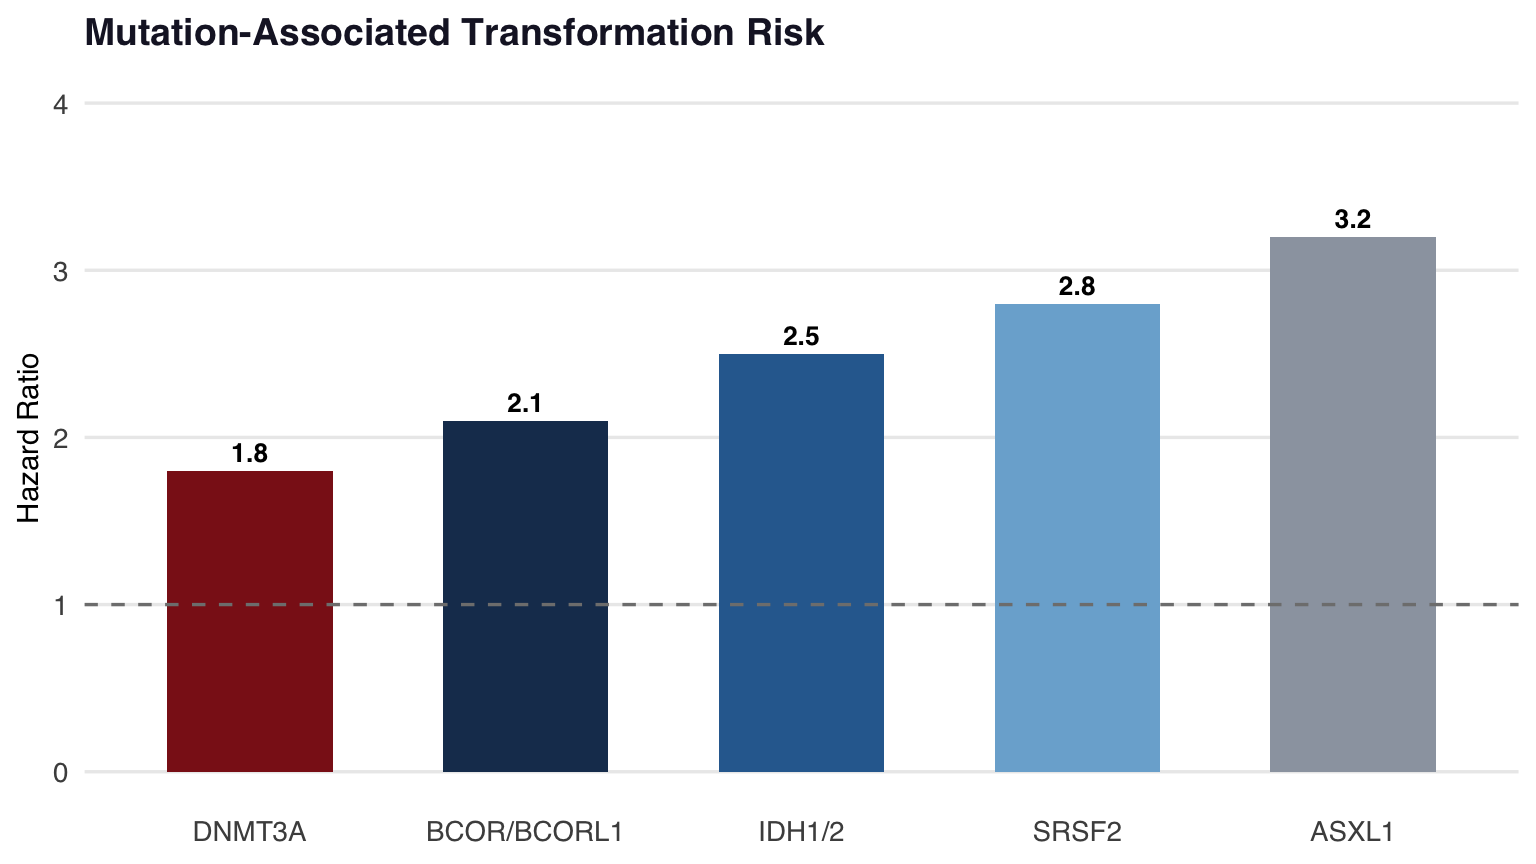
#| fig-cap: "Cumulative transformation risk and mutation-associated hazard ratios"
#| fig-height: 4.5
#| layout-ncol: 2
# Panel A: Cumulative risk
tibble(
  year = rep(c(0, 5, 10, 15, 20, 25), 2),
  event = rep(c("Post-PV MF", "AML"), each = 6),
  risk = c(0, 2, 5, 10, 16, 22, 0, 0.5, 1.5, 3, 5, 7)
) |>
  ggplot(aes(x = year, y = risk, color = event, fill = event)) +
  geom_line(linewidth = 1.2) +
  geom_area(alpha = 0.1, position = "identity") +
  scale_color_manual(values = c("Post-PV MF" = pal$rusf, "AML" = pal$blue)) +
  scale_fill_manual(values = c("Post-PV MF" = pal$rusf, "AML" = pal$blue)) +
  scale_y_continuous(labels = percent_format(scale = 1), limits = c(0, 30)) +
  labs(title = "Cumulative Transformation Risk",
       x = "Years from diagnosis", y = "Cumulative risk (%)", color = NULL, fill = NULL) +
  theme_pv

# Panel B: Mutation HRs
tibble(
  mutation = c("ASXL1", "SRSF2", "IDH1/2", "BCOR/BCORL1", "DNMT3A"),
  hr = c(3.2, 2.8, 2.5, 2.1, 1.8)
) |>
  mutate(mutation = fct_reorder(mutation, hr)) |>
  ggplot(aes(x = mutation, y = hr, fill = mutation)) +
  geom_col(width = 0.6, show.legend = FALSE) +
  geom_hline(yintercept = 1, linetype = "dashed", color = "grey50") +
  geom_text(aes(label = hr), vjust = -0.5, fontface = "bold", size = 3.5) +
  scale_fill_manual(values = c(pal$rusf, pal$blue, pal$blue_mid, "#7BAFD4", pal$placebo)) +
  scale_y_continuous(limits = c(0, 4)) +
  labs(title = "Mutation-Associated Transformation Risk",
       x = NULL, y = "Hazard Ratio") +
  theme_pv
```
```{r tbl-risk}
tibble(
  Factor = c("Age >60", "Leukocytosis (WBC >15)", "ASXL1", "SRSF2",
             "IDH1/2", "BM fibrosis ≥2", "Prior alkylating agents"),
  `MF Risk`  = c("↑", "↑↑", "↑↑↑", "↑↑", "↑", "↑↑↑", "↑"),
  `AML Risk` = c("↑↑", "↑", "↑↑", "↑↑↑", "↑↑↑", "↑", "↑↑↑"),
  Notes = c("Confounded by treatment duration", "Independent predictor",
            "Strongest genetic predictor", "Associated with leukemic transformation",
            "Targetable with IDH inhibitors", "Surrogate on serial biopsy",
            "Therapy-related risk")
) |>
  gt() |>
  tab_header(title = "Risk Factors for Disease Transformation in PV") |>
  tab_style(
    style = cell_text(weight = "bold", color = "#8B1A1A"),
    locations = cells_body(columns = `MF Risk`, rows = c(3, 6))
  ) |>
  tab_style(
    style = cell_text(weight = "bold", color = "#8B1A1A"),
    locations = cells_body(columns = `AML Risk`, rows = c(4, 5, 7))
  ) |>
  opt_row_striping() |>
  tab_options(table.font.size = px(13))
```